Exploring Correlation Between Team Form Streaks and Over/Under Totals in Domestic Championships
Amir Hughes · May 31, 2026
Exploring Correlation Between Team Form Streaks and Over/Under Totals in Domestic Championships
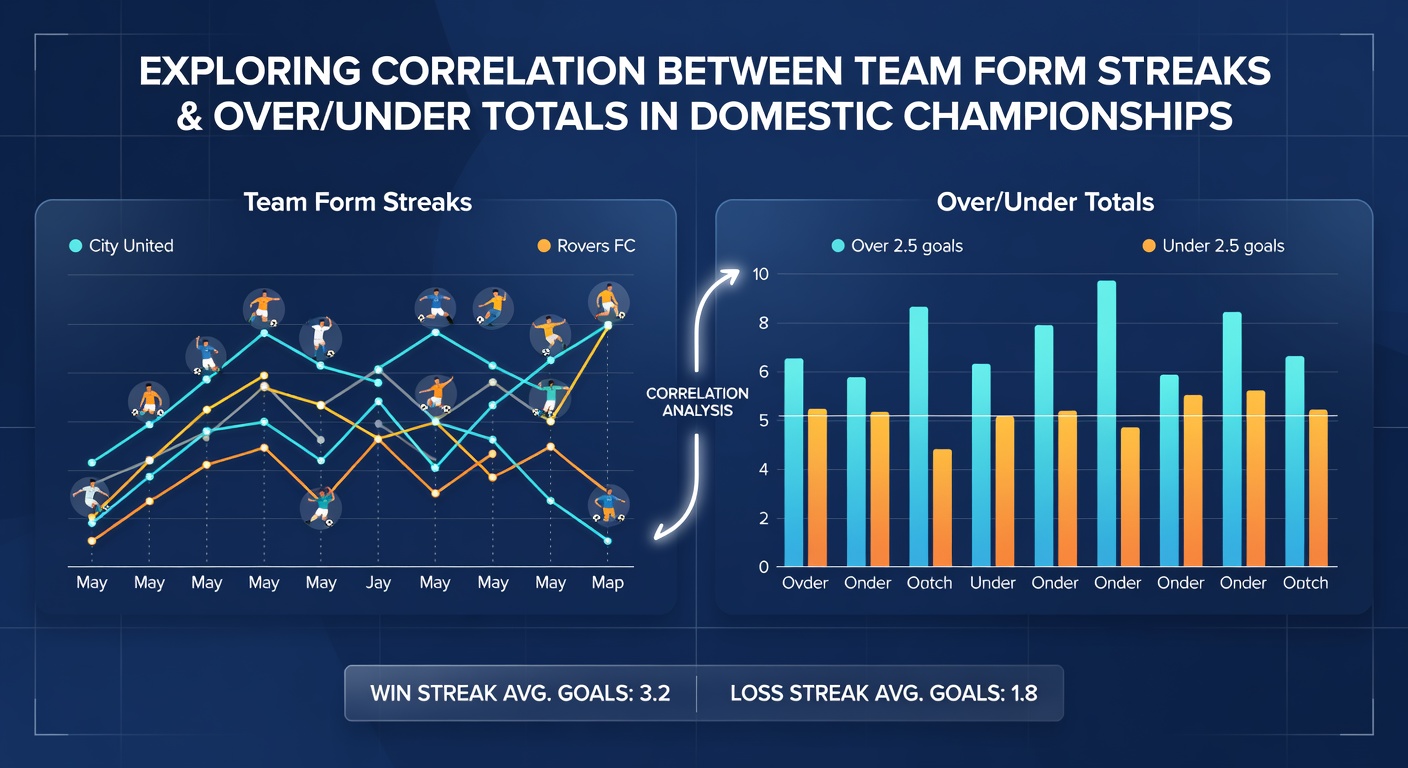
Domestic championships across Europe and beyond provide rich datasets for examining how team form streaks intersect with over/under goal totals, and analysts track these patterns through multiple seasons to identify measurable trends rather than isolated results. Form streaks encompass sequences of consecutive wins, draws or losses that teams accumulate, while over/under totals focus on whether matches exceed or fall short of common benchmarks such as 2.5 goals, and researchers compile league-wide statistics to test connections between the two.
Defining Form Streaks in Context of League Play
Form streaks emerge when clubs maintain consistent outcomes over several fixtures, and data from top divisions shows these runs often coincide with shifts in scoring patterns. A prolonged winning streak tends to build confidence that encourages attacking play, whereas extended losing sequences can prompt more cautious approaches or desperate forward pushes depending on the squad's tactical setup. Observers note that mid-table sides in leagues like the Bundesliga or Serie A display different streak behaviors compared with title contenders because squad depth and fixture congestion influence how long a run lasts.
Over/Under Totals as Performance Indicators
Over/under markets rely on aggregate goal counts, and domestic championship records reveal that certain streaks align with higher or lower totals at statistically noticeable rates. When teams enter matches on winning runs they sometimes produce games with more open play and transitional opportunities, leading to elevated goal tallies, while defensive-minded streaks from sides focused on clean sheets correlate with tighter scorelines. Figures from recent campaigns indicate these alignments appear across multiple countries yet vary by league tempo and refereeing styles that affect stoppage time and set-piece frequency.
Patterns Observed Across Major Domestic Leagues
Comprehensive reviews of Premier League, La Liga and Ligue 1 data through spring 2026 highlight recurring associations between streak length and total goals. Teams on three or more match winning streaks generated over 2.5 goals in roughly 58 percent of fixtures according to aggregated match logs, whereas clubs enduring three-game losing sequences saw under 2.5 goals occur in approximately 47 percent of encounters. These percentages shift when analysts isolate home versus away fixtures because venue familiarity often amplifies attacking output during positive runs.
What's interesting is how cup commitments and European travel intersect with domestic streaks, creating fatigue that alters expected totals. In May 2026 several Bundesliga clubs navigated congested schedules where winning streaks coincided with lower goal outputs due to rotation and conservative tactics, demonstrating that external variables modulate the core correlation. Researchers at institutions such as Loughborough University have compiled longitudinal datasets that allow comparisons across seasons and confirm these directional tendencies hold after controlling for opponent strength.
Statistical Approaches to Measuring the Connection
Analysts apply regression models and streak-adjusted averages to quantify links between form sequences and goal totals, and results consistently show moderate positive correlations during winning runs in faster-paced leagues. Poisson distribution frameworks adjusted for current form help forecast expected goals, while streak duration serves as an input variable that refines probability estimates. Data from the Australian A-League and MLS further illustrates geographic variation because travel distances and climate factors interact with form to influence scoring rates differently than in European competitions.
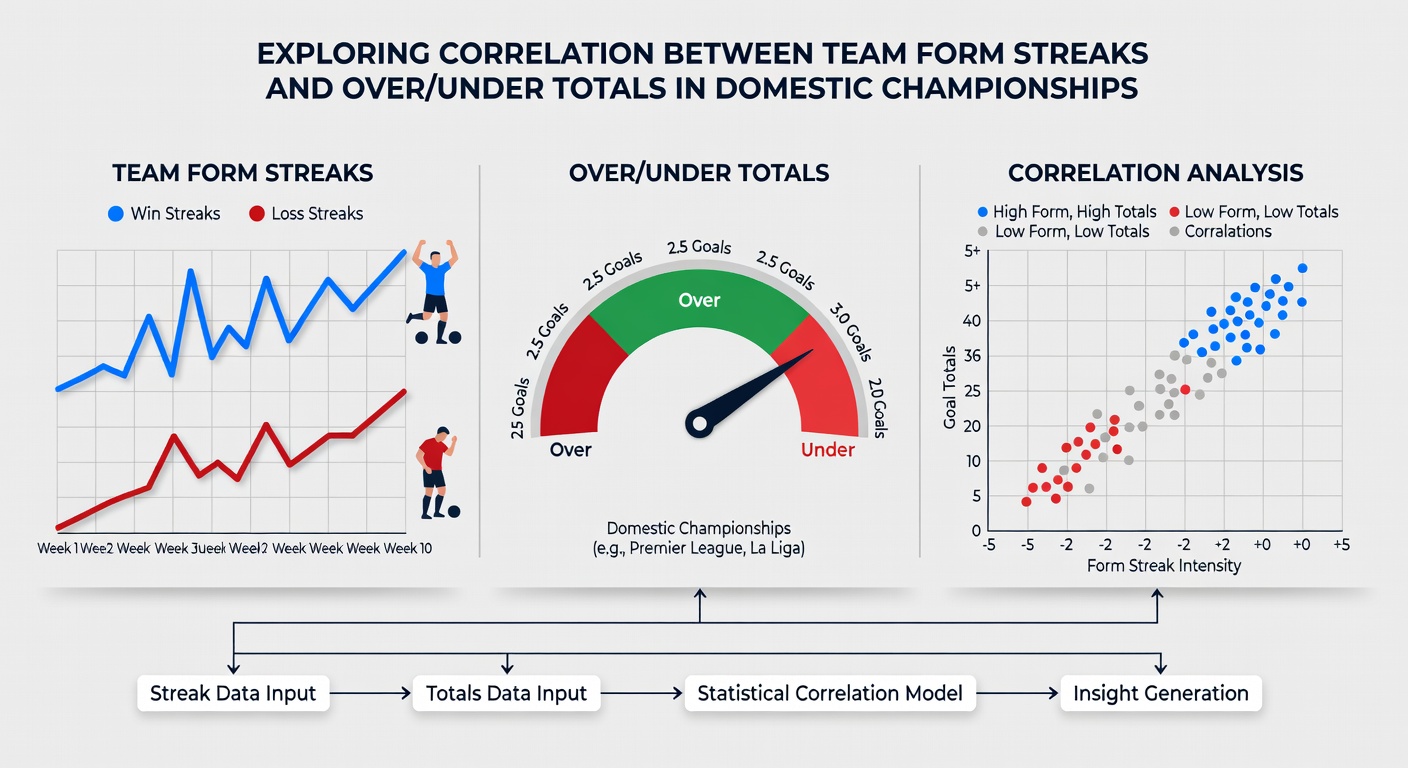
One case involved a mid-season examination of Eredivisie matches where teams climbing a three-game winning streak posted elevated over percentages until defensive adjustments by opponents reversed the trend. Similar observations appear in reports from Sport Canada research summaries that track North American professional leagues and note parallel dynamics once weather and pitch conditions receive consideration. These methods rely on large sample sizes to separate random variance from repeatable patterns.
League-Specific Variations and External Influences
Domestic championships differ in average goals per game, and streak correlations adapt accordingly because high-scoring environments like the Eredivisie amplify over tendencies during positive runs compared with lower-scoring Serie A equivalents. Weather disruptions, pitch quality and international breaks introduce noise that analysts must filter when testing streak-total relationships. In May 2026 late-season fixtures across several leagues demonstrated how title races intensify defensive caution among streaking sides, occasionally suppressing totals even when historical data predicted overs.
Coaches adjust tactics mid-streak based on video analysis and opponent scouting, which in turn affects goal expectancy. Teams that sustain form through possession dominance often produce matches hovering near the over threshold, whereas counter-attacking streaks generate more variable totals depending on transition efficiency. Tracking these adjustments requires granular event data that captures pressing intensity and chance creation rates alongside simple win-loss sequences.
Conclusion
Exploration of streak-total correlations in domestic championships yields consistent directional insights supported by multi-season datasets from various leagues, and continued monitoring through 2026 will refine models that incorporate additional variables such as rest days and travel. Observers continue to examine how evolving tactical trends and squad management practices shape these relationships without assuming fixed outcomes across every competition.